
Understanding Dashboard Widgets: Your Path to Smarter Data Analysis
Dashboard widgets are the building blocks of a personalized and efficient data visualization experience. By offering customizable and dynamic insights, these widgets transform complex metrics into clear, actionable information. Whether you’re tracking sales performance, monitoring campaigns, or assessing team productivity, dashboard widgets provide the flexibility and precision to meet your unique needs. Dive into this guide to explore how widgets work, their customization options, and how they can enhance your decision-making processes.
What are Dashboard Widgets
Dashboard widgets are highly versatile and customizable tools designed to simplify data visualization and analysis. They provide instant access to key metrics, enabling efficient monitoring and insightful reporting. Adding widgets to your dashboard is effortless—simply click the "Add Widget" button in the top-right corner to get started.
Whether you choose from predefined chart types or design custom widgets tailored to your needs, dashboard widgets offer unmatched flexibility. The intuitive editing mode allows for seamless management and customization, ensuring your dashboard aligns perfectly with your workflow. These features empower you to create dynamic dashboards that streamline data analysis and support smarter decision-making.
To make widget selection even more convenient, widgets are categorized into specific groups. This organization helps you quickly find the tools you need, saving time and unlocking valuable insights from your data. With a structured approach, you can maximize the potential of your dashboards and achieve greater efficiency.

Using Elements in your Dashboard
Elements bring unmatched flexibility to your dashboard, allowing you to organize and enhance widget presentations effectively. You can add titles or headings to clearly define sections, group widgets by themes, or use textboxes for displaying important information or task reminders—boosting team communication.
Additionally, elements enable you to incorporate visual enhancements like logos, charts, or infographics. These features not only make your dashboard more visually engaging but also provide essential context, helping you present data more effectively. Use elements to craft a professional and intuitive dashboard that fits your unique needs.
Embedding dynamic content into your dashboard has never been easier with the ability to inject user or sub-account properties directly via iframes. By entering the Edit Mode, you can seamlessly navigate to the Objects tab, select the Embed option, and input the desired URL. Add parameters to customize the content and enhance its relevance by utilizing dynamic user properties, such as user IDs or location data, through simple placeholders like {{location.id}}. This approach allows for a versatile and personalized dashboard experience, aligning embedded content with user-specific needs effortlessly.
Supported user properties provide an additional layer of customization. You can pass various details—such as company ID, email, phone, or user roles—into the URL. These properties enable precise tailoring of embedded content, ensuring a more user-centric dashboard setup. For instance, adding {{user.firstName}} to a URL dynamically displays the user's first name, creating a more personalized interaction. With these advanced features, the dashboard becomes a hub for both data visualization and customized content delivery.

Widget Categories and their Widgets
Our Widgets are organized in the following Categories. In the following Paragraphs you will get an Overview/List of Widgets we offer and what they are used for.

Contacts
Contact widgets help you efficiently manage and analyze new leads, providing a clear overview of your contact data and engagement.
- Contact Count: Provides a quick snapshot of the total contacts managed by your team, useful for tracking overall growth.
- Contact Count (Logged-in User): Displays the number of contacts assigned specifically to you, helping you focus on your responsibilities.
- Contacts by Tags: Categorize and monitor your contacts using tags like “Hot Leads” or “New Prospects.”
- Contacts by Activity: Tracks the number of contacts engaging in specific activities within a chosen timeframe.
- Contacts by Type: Offers a visual breakdown of contact categories for better organization.
- Contacts by Assigned User: Shows how contacts are distributed across team members.
- Contacts by Company Name: Insights into contact distribution across different companies.
- Contacts with Email: Tracks contacts with provided email addresses.
- Contacts without Emails: Highlights contacts without email addresses.
- Contacts with Phone Numbers: Displays contacts with available phone numbers.
- Contacts without Phone Numbers: Monitors contacts lacking phone numbers.
- Total Contacts Count (Till Date): A cumulative count of all contacts added so far.
- Total Contacts Count (This Month): Tracks newly added contacts this month.
- Contacts Count (Logged-in User): Focuses on contacts specifically tied to the logged-in user.
Appointments
Appointment widgets assist in tracking and optimizing meetings with your team and customers, ensuring you stay organized and on schedule.
- Appointment Count: Summarizes the total appointments, categorized by status or assignee.
- Appointment Count Over a Date Range: Tracks appointments within a specified period for detailed analysis.
- Appointment Counts by Status: Visualizes appointments across statuses like “Confirmed” or “No Show.”
- Booked Appointments: Tracks total booked appointments.
- Confirmed Appointments: Displays confirmed appointments for a selected timeframe.
- Showed Appointments: Shows how many appointments customers attended.
- No Show Appointments: Highlights missed appointments.
- Cancelled Appointments: Tracks invalid or cancelled appointments.
- No Show Rate Over Time: Observes trends in “No Show” appointments over time.
- Upcoming Appointments (Week): Previews appointments scheduled for the week ahead.
- Upcoming Appointments (Logged-in User): Focuses on the logged-in user’s scheduled appointments.
- Past Month Created Appointments: Shows appointments created in the previous month.
- Past Month Created Appointments (Logged-in User): Breaks down the logged-in user’s monthly statistics.
- Upcoming Appointments for Next Week: Plans appointments for the next week.
- Past Month Created Appointments (Logged-in User): Details individual stats for appointments logged previously.
Opportunity
Opportunity widgets offer valuable insights into deal statuses and monetary values, enabling better pipeline management.
- Opened Opportunities: Displays all currently active opportunities.
- Won Opportunities: Records successful opportunities turned into deals.
- Lost Opportunities: Tracks deals that didn’t close.
- Abandoned Opportunities: Keeps tabs on inactive opportunities.
- Opportunity Count: The total count of opportunities managed.
- Opportunity Counts Over Time: Tracks the progression of opportunities over time.
- Opportunity Revenue Over Time: Monitors revenue from opportunities.
- Opportunity Counts by Status: Categorizes opportunities as "In Progress," "Closed," etc.
- Opened Opportunity Value: Calculates the monetary value of open opportunities.
- Lost Opportunity Value: Highlights the financial impact of lost opportunities.
- Abandoned Opportunity Value: Displays the value of opportunities that were abandoned.
- Won Opportunity Value: Focuses on revenue generated from closed deals.
- Total Opportunity Value: Aggregates the overall monetary value of all opportunities.
- Lost Opportunities by Reason: Categorizes reasons for failed deals.
Visitor Data
Gain an overview of your funnel visitors’ activity and relevant information with visitor data widgets, enhancing your marketing insights.
- Total Funnel Views: Tracks views across all funnels, customizable by funnel and page type.
- Unique Funnel Views: Counts unique visitors across all funnels.
- Total Website Views: Displays the total number of views for all websites.
- Unique Website Views: Tracks unique visitors across all websites.
- Funnel Views Trend: Provides a line chart showing trends in funnel views over time.
- Website Views Trend: Displays a line chart tracking trends in website views.
- Top Funnels by Unique Views: Lists the top 5 funnels ranked by unique visitor counts.
- Top Websites by Unique Views: Highlights the top 5 websites with the highest unique visitor counts.
- Total Funnel Page Views (Last Week): Monitors funnel page views over the past week.
- Unique Funnel Views (Last Week): Tracks unique funnel visitors from the past week.
- Total Funnel Page Views (Last Month): Aggregates funnel views over the last month.
- Unique Funnel Views (Last Month): Displays unique funnel visitors for the past month.
- Total Opt-Ins (All Funnels): Counts all opt-ins across all funnels.
Emails
Email widgets provide visibility into campaign activities, helping you track performance and optimize your communication efforts.
- Accepted Emails: Counts emails successfully accepted by recipients’ servers.
- Delivered Emails: Tracks emails delivered to recipients.
- Opened Emails: Displays the number of emails opened by recipients.
- Clicked Emails: Highlights the number of emails where links were clicked.
- Replied Emails: Tracks the number of emails that received replies.
- Soft Bounced Emails: Shows emails that temporarily failed to deliver.
- Hard Bounced Emails: Indicates emails that permanently failed delivery.
- Failed Emails: Aggregates all failed email delivery attempts.
- Unsubscribed Emails: Counts recipients who unsubscribed from future emails.
- Unsubscribed Emails Daily: Tracks the daily count of unsubscribed recipients.
- Emails by Domain: Groups emails based on recipient domains.
Calls
Call widgets deliver detailed insights about your call activities, ensuring better tracking and improved follow-ups.
- Incoming Calls by Status: Categorizes incoming calls based on their status.
- Outgoing Calls by Status: Groups outgoing calls by their status.
- Incoming Calls Total Call Duration: Calculates the total duration of incoming calls.
- Outgoing Calls Total Call Duration: Displays the total duration of outgoing calls.
- Incoming Calls Avg. Call Duration: Tracks the average duration of incoming calls.
- Outgoing Calls Avg. Call Duration: Displays the average duration of outgoing calls.
- Total Calls Placed by Call Attendee: Aggregates outgoing calls based on the user who placed them.
- Incoming Calls Avg. Call Duration by Call Attendee: Displays the average duration of incoming calls by team members.
- Outgoing Calls Avg. Call Duration by Call Attendee: Shows the average duration of outgoing calls by individual users.
- First Time Call by Status: Tracks first-time calls categorized by their status.
- First Time Call Avg. Duration: Displays the average duration of first-time calls.
- First Time Call Avg. Duration by Call Attendee: Highlights average call durations for first-time callers based on the team member.
- First Time Call Total Duration: Calculates the total duration of all first-time calls.
Conversations
Conversation widgets let you monitor and track conversation data, offering an overview of ongoing customer interactions.
- Total Unread Conversations: Displays the count of unread conversations.
- Total Unread Conversations Today: Highlights unread conversations from today.
- Total Unread Conversations by Channel: Groups unread conversations by their communication channel (e.g., email, SMS).
- Unread Conversations by Assignee: Tracks unread conversations assigned to team members.
- Unread Conversations (Logged-in User): Highlights unread conversations specifically assigned to the logged-in user.
- Conversations Distribution by Assignee: Shows how conversations are distributed among team members.
- Assigned Conversations (Logged-in User): Displays conversations assigned to the logged-in user.
- Total Unassigned Conversations: Lists all unassigned conversations.
- Unassigned Conversations by Channel: Groups unassigned conversations based on their channel.
- New Conversations Started (This Week): Counts the new conversations initiated in the current week.
General
General widgets include predefined data and performance reports for various platforms, making it easy to track key metrics and trends.
- Opportunity Status: Provides a visualization of the current status of all opportunities.
- Opportunity Value: Tracks the total monetary value of all opportunities.
- Conversion Rate: Displays the percentage of won opportunities versus total opportunities.
- Funnel: Gives detailed insights into the sales funnel, including conversion rates at each stage.
- Stages Distribution: Highlights how opportunities are distributed across different sales stages.
- Tasks: Monitors tasks added and assigned to team members.
- Manual Actions: Tracks manual actions like SMS or calls within campaigns.
- Lead Source Report: Offers an overview of leads categorized by source.
- Google Analytics Count: Displays total website views reported by Google Analytics.
- Google Analytics Chart: Visualizes metrics like direct and paid views from Google Analytics.
- Google Business Profile: Summarizes views and interactions from your Google Business Profile.
- Facebook Ads Report: Tracks clicks, CTR, CPC, and total spending for Facebook ads.
- Google Ads Report: Monitors clicks, CTR, CPC, and total spend for Google ads.
- Sales Efficiency: Evaluates sales efficiency metrics like average sales duration and velocity.
How To: Customize Dashboard Widgets
How To: Customize Dashboard Widgets
Mastering Dashboard Widgets: A Step-by-Step Customization Guide
Dashboard widgets are essential tools for visualizing key data points, offering insights into your business's performance. Customizing these widgets ensures they align with your specific goals and reporting needs. This guide provides a comprehensive walkthrough on modifying widget settings, applying filters, experimenting with various chart types, and fine-tuning displays. By tailoring your dashboard widgets, you can transform your dashboard into an effective and visually compelling data center, enhancing your ability to make informed decisions.
Step 1: Access Your Dashboard
- Navigate to the dashboard feature to view your default Dashboard.

- Switch to the Dashboard you want to edit and ensure you are in "Edit Mode" to make changes to the layout or widgets.

Step 2.1: Open and Configure the Widget Settings
- Locate the widget you'd like to customize.
- Hover over it and click on the Settings Icon in the top-right corner of the widget, select the “Edit” Button.

- This opens the settings panel, where you can make adjustments. Also choose a chart type for the selected Widget in the top section of the Settings Panel.

Here you can rename the Widgets Title, update the data points displayed in the widget under Metrics, define grouping options for charts, select the secondary dimension for visualizations like line or bar charts, adjust the time period frequency, choose the date type and much more. Some of the following Settings are Advanced Settings which are optional settings for further personalization. Some of these Settings will not be available depending on which Widget you are editing.
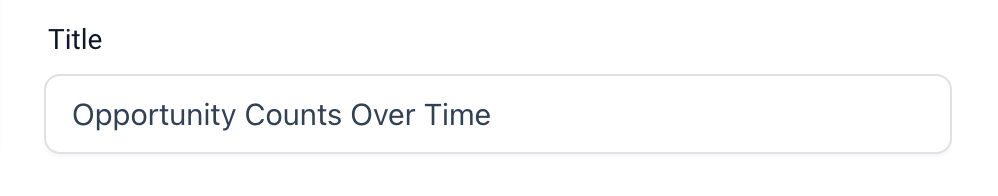
Title
Rename the widget to make its purpose clear.
Metrics
Update the data points displayed in the widget.

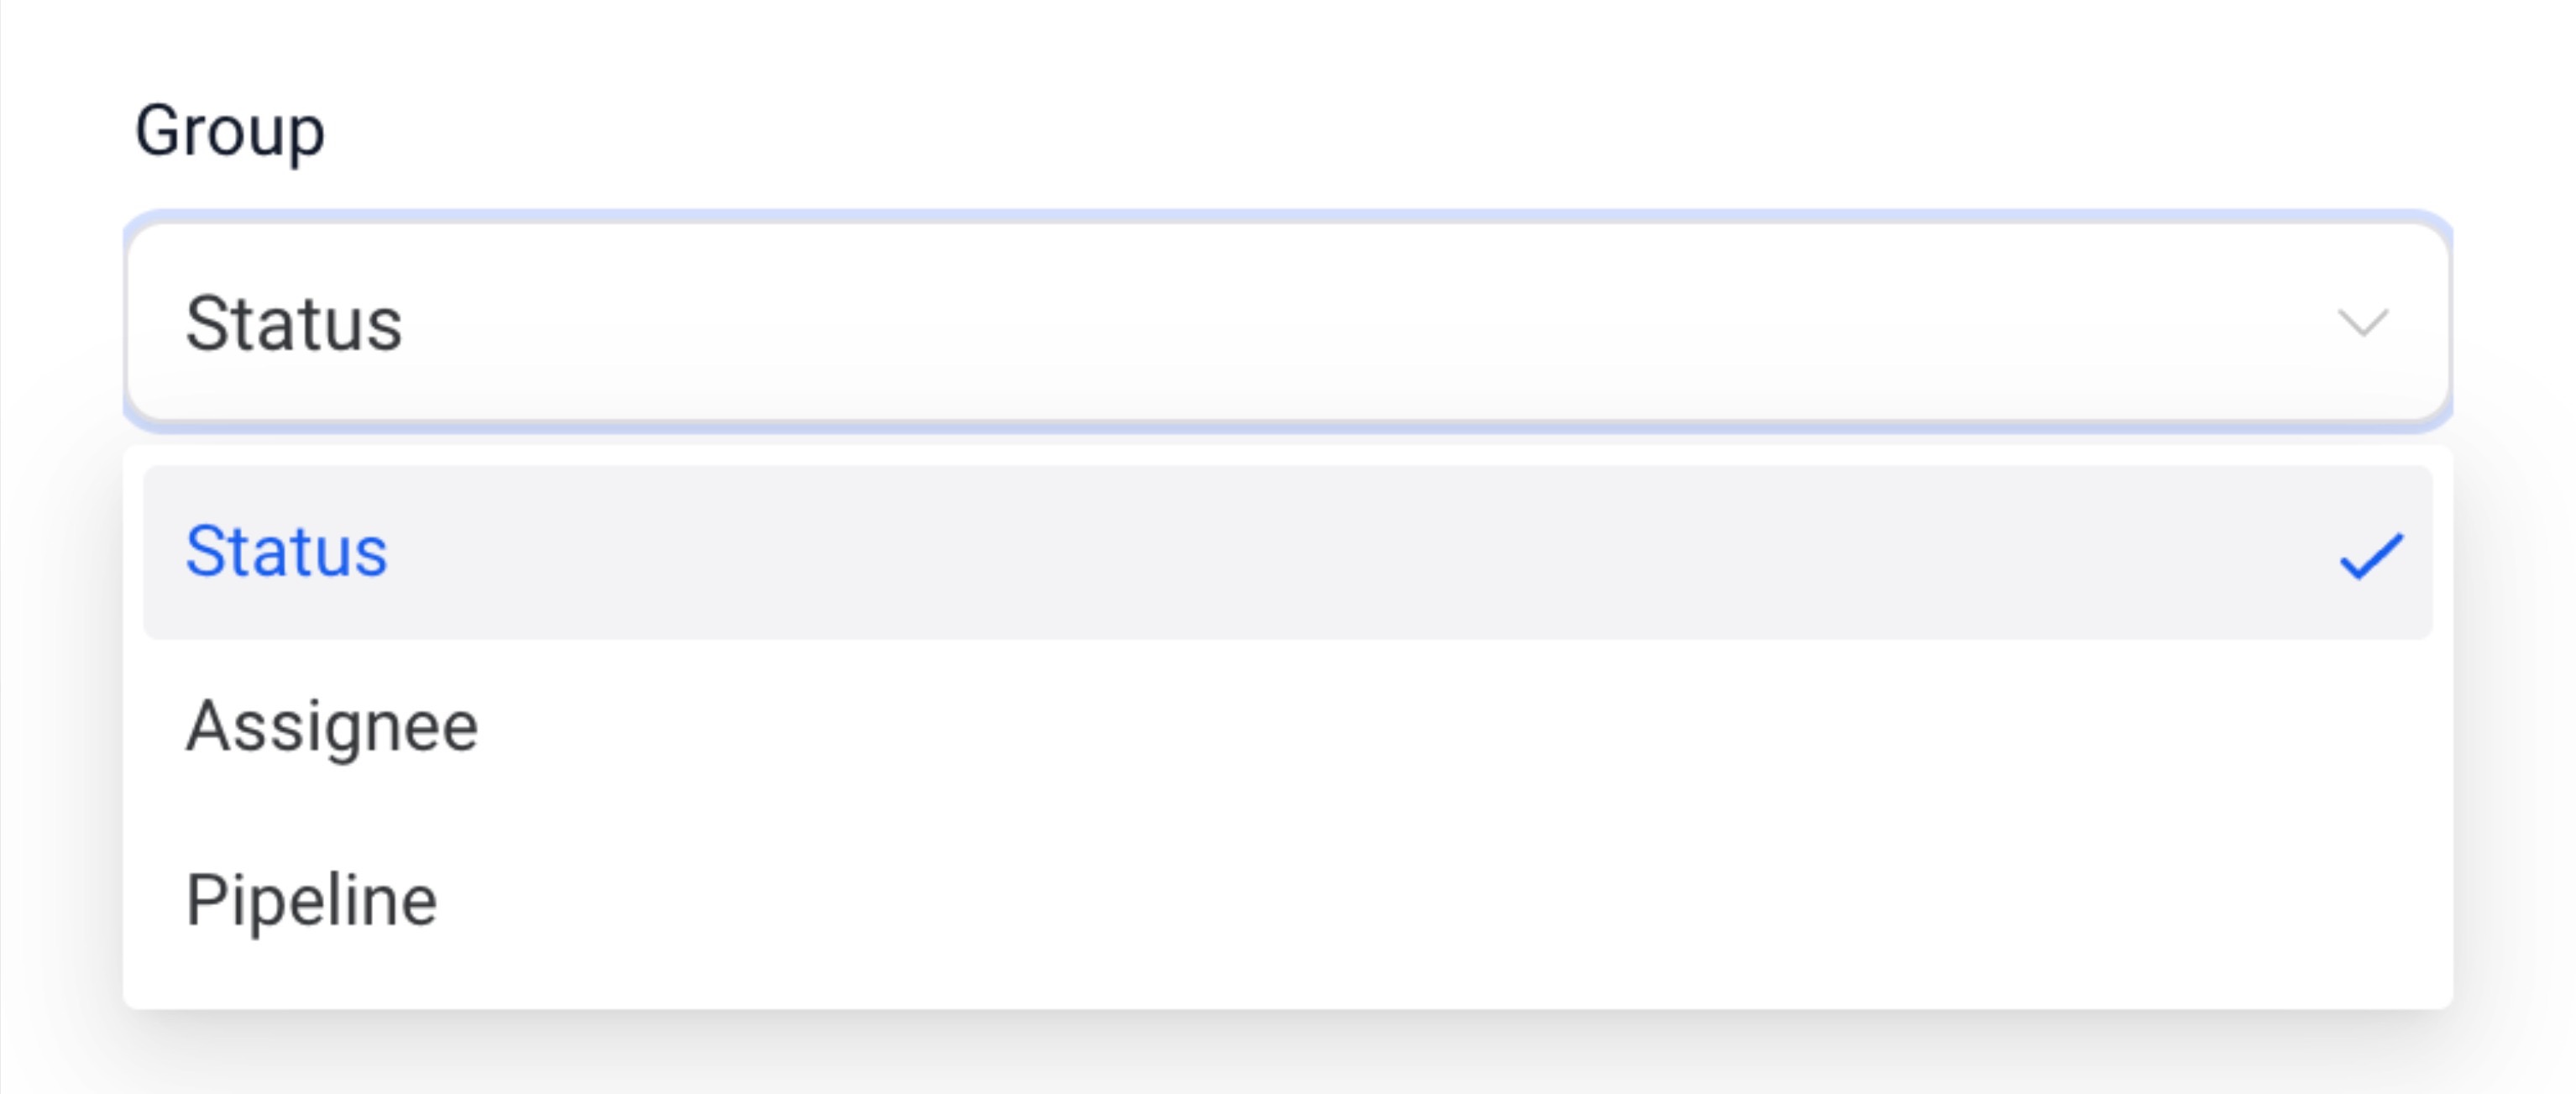
Group
Define grouping options for charts like a Donut or Bar Chart.
View By
Select the secondary dimension for visualizations like line or bar charts.
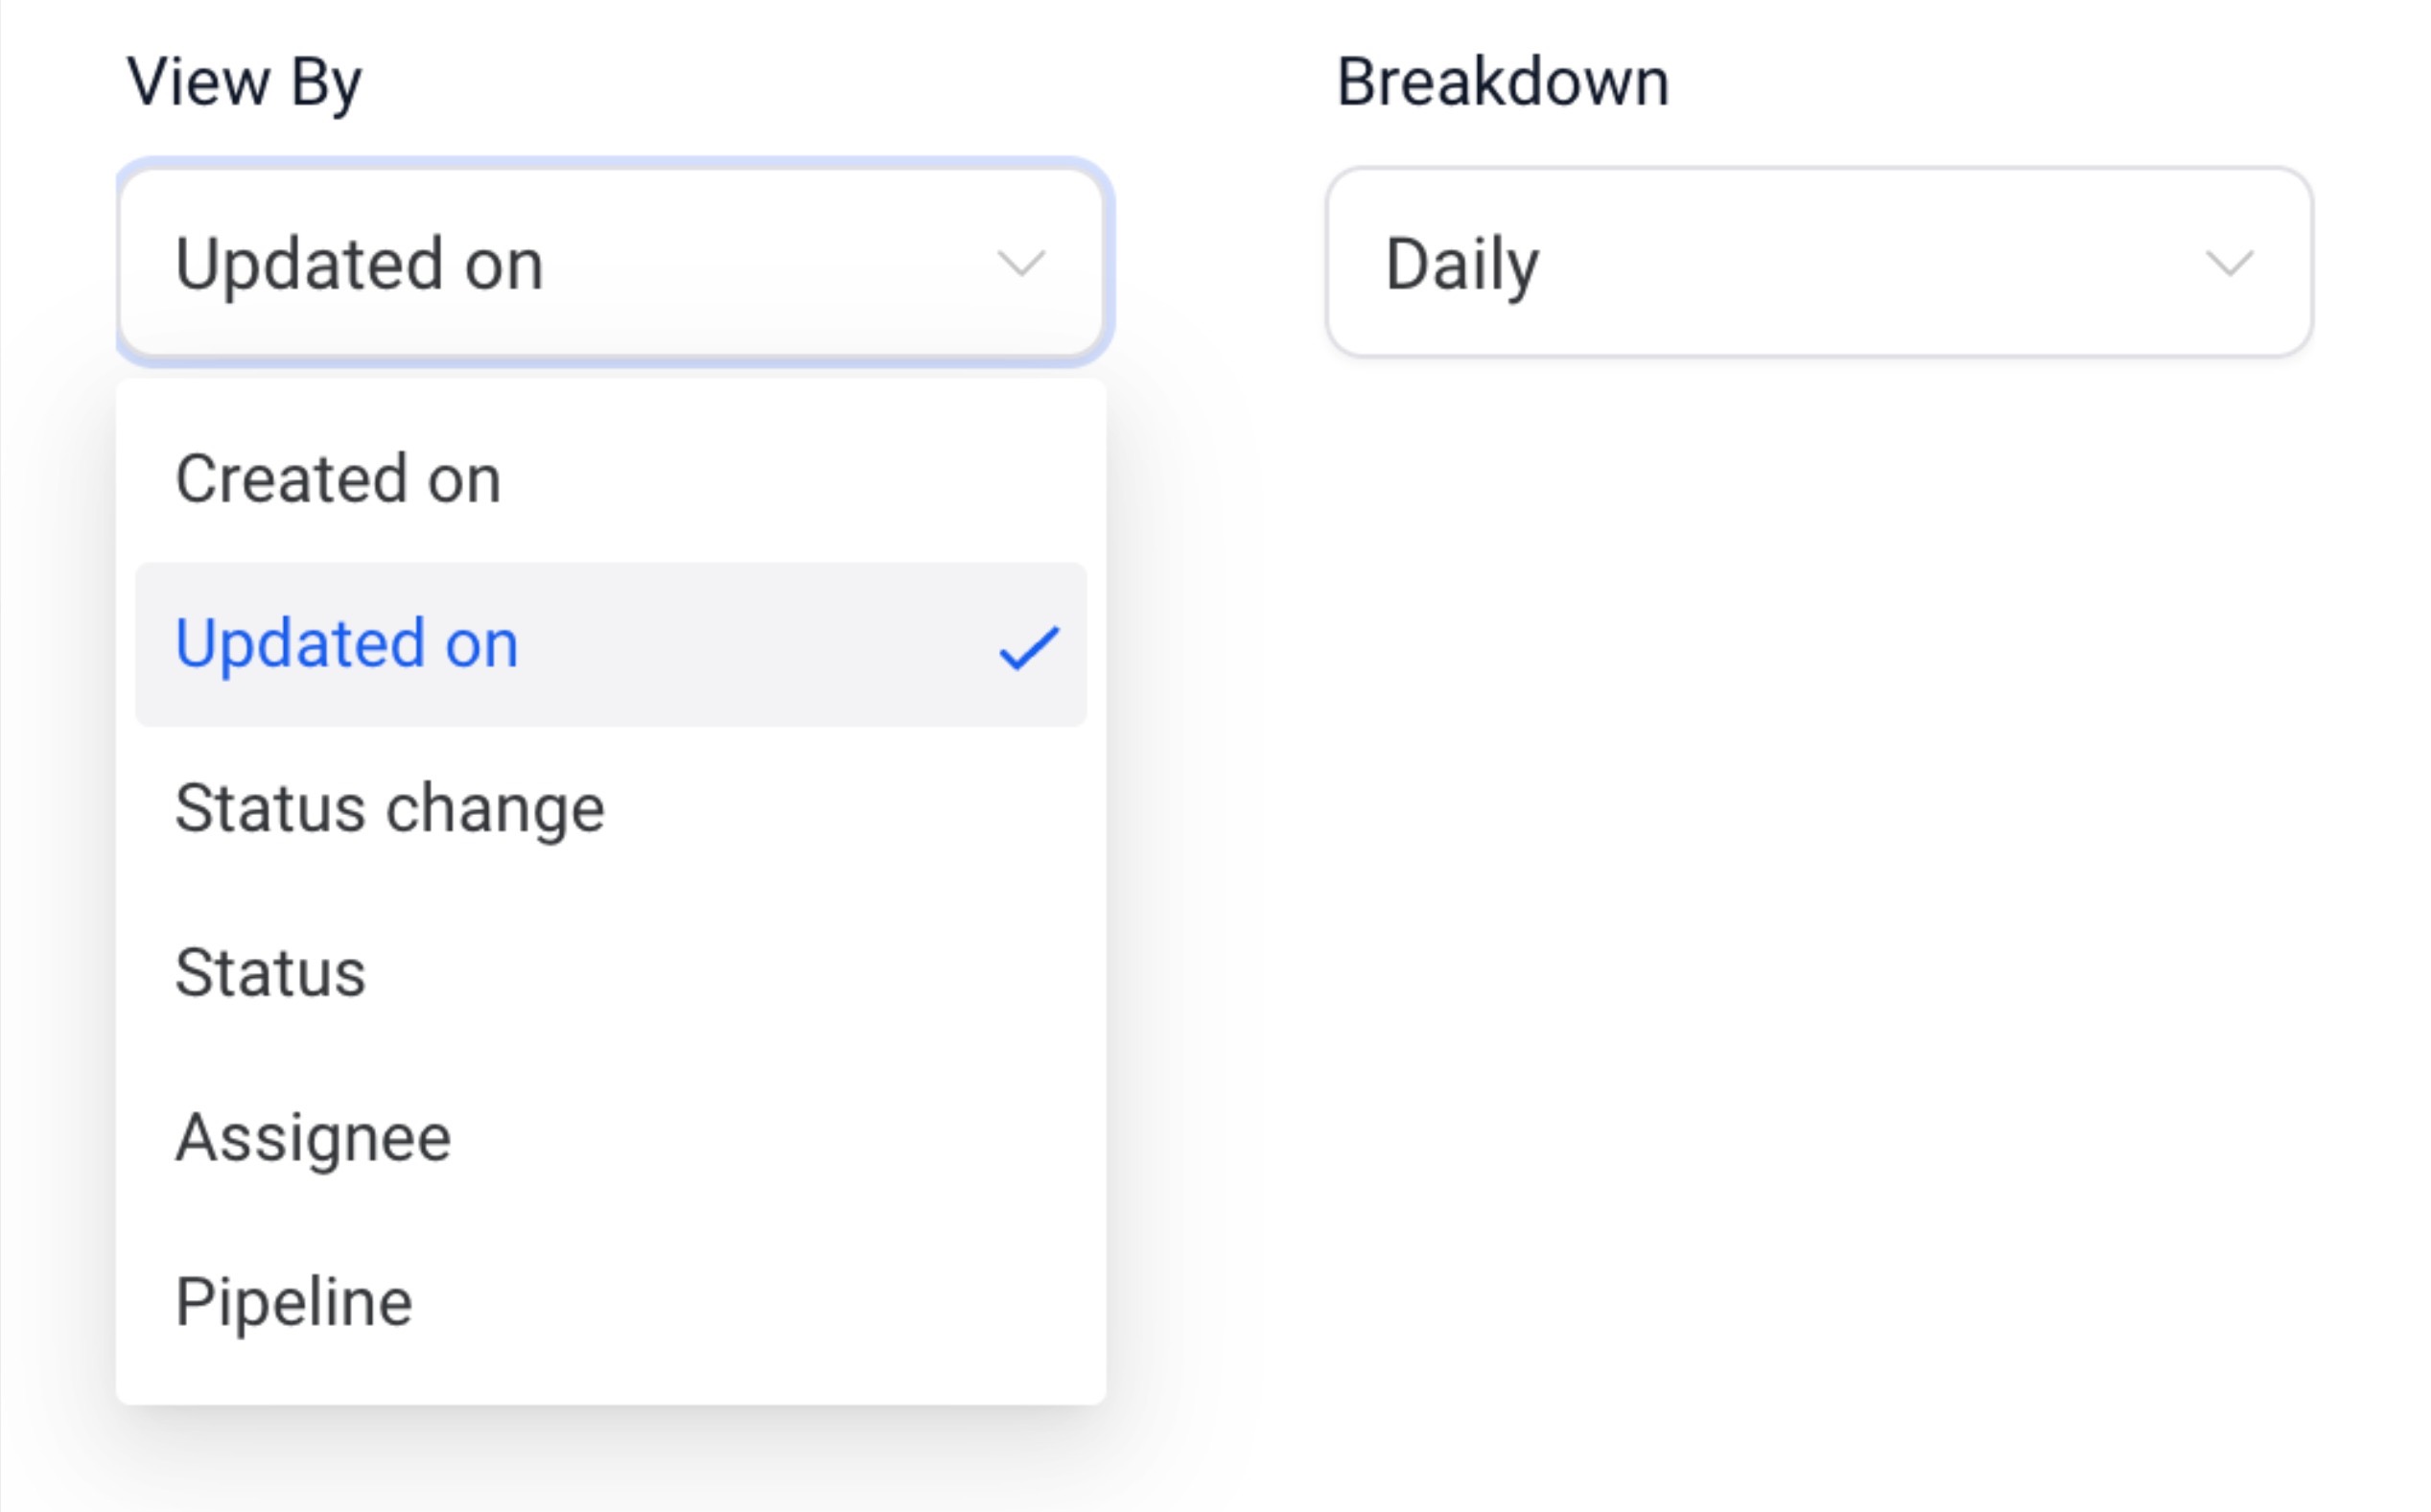
Breakdown
Adjust the time period frequency.
Date Property
Choose the date type for fetching results.

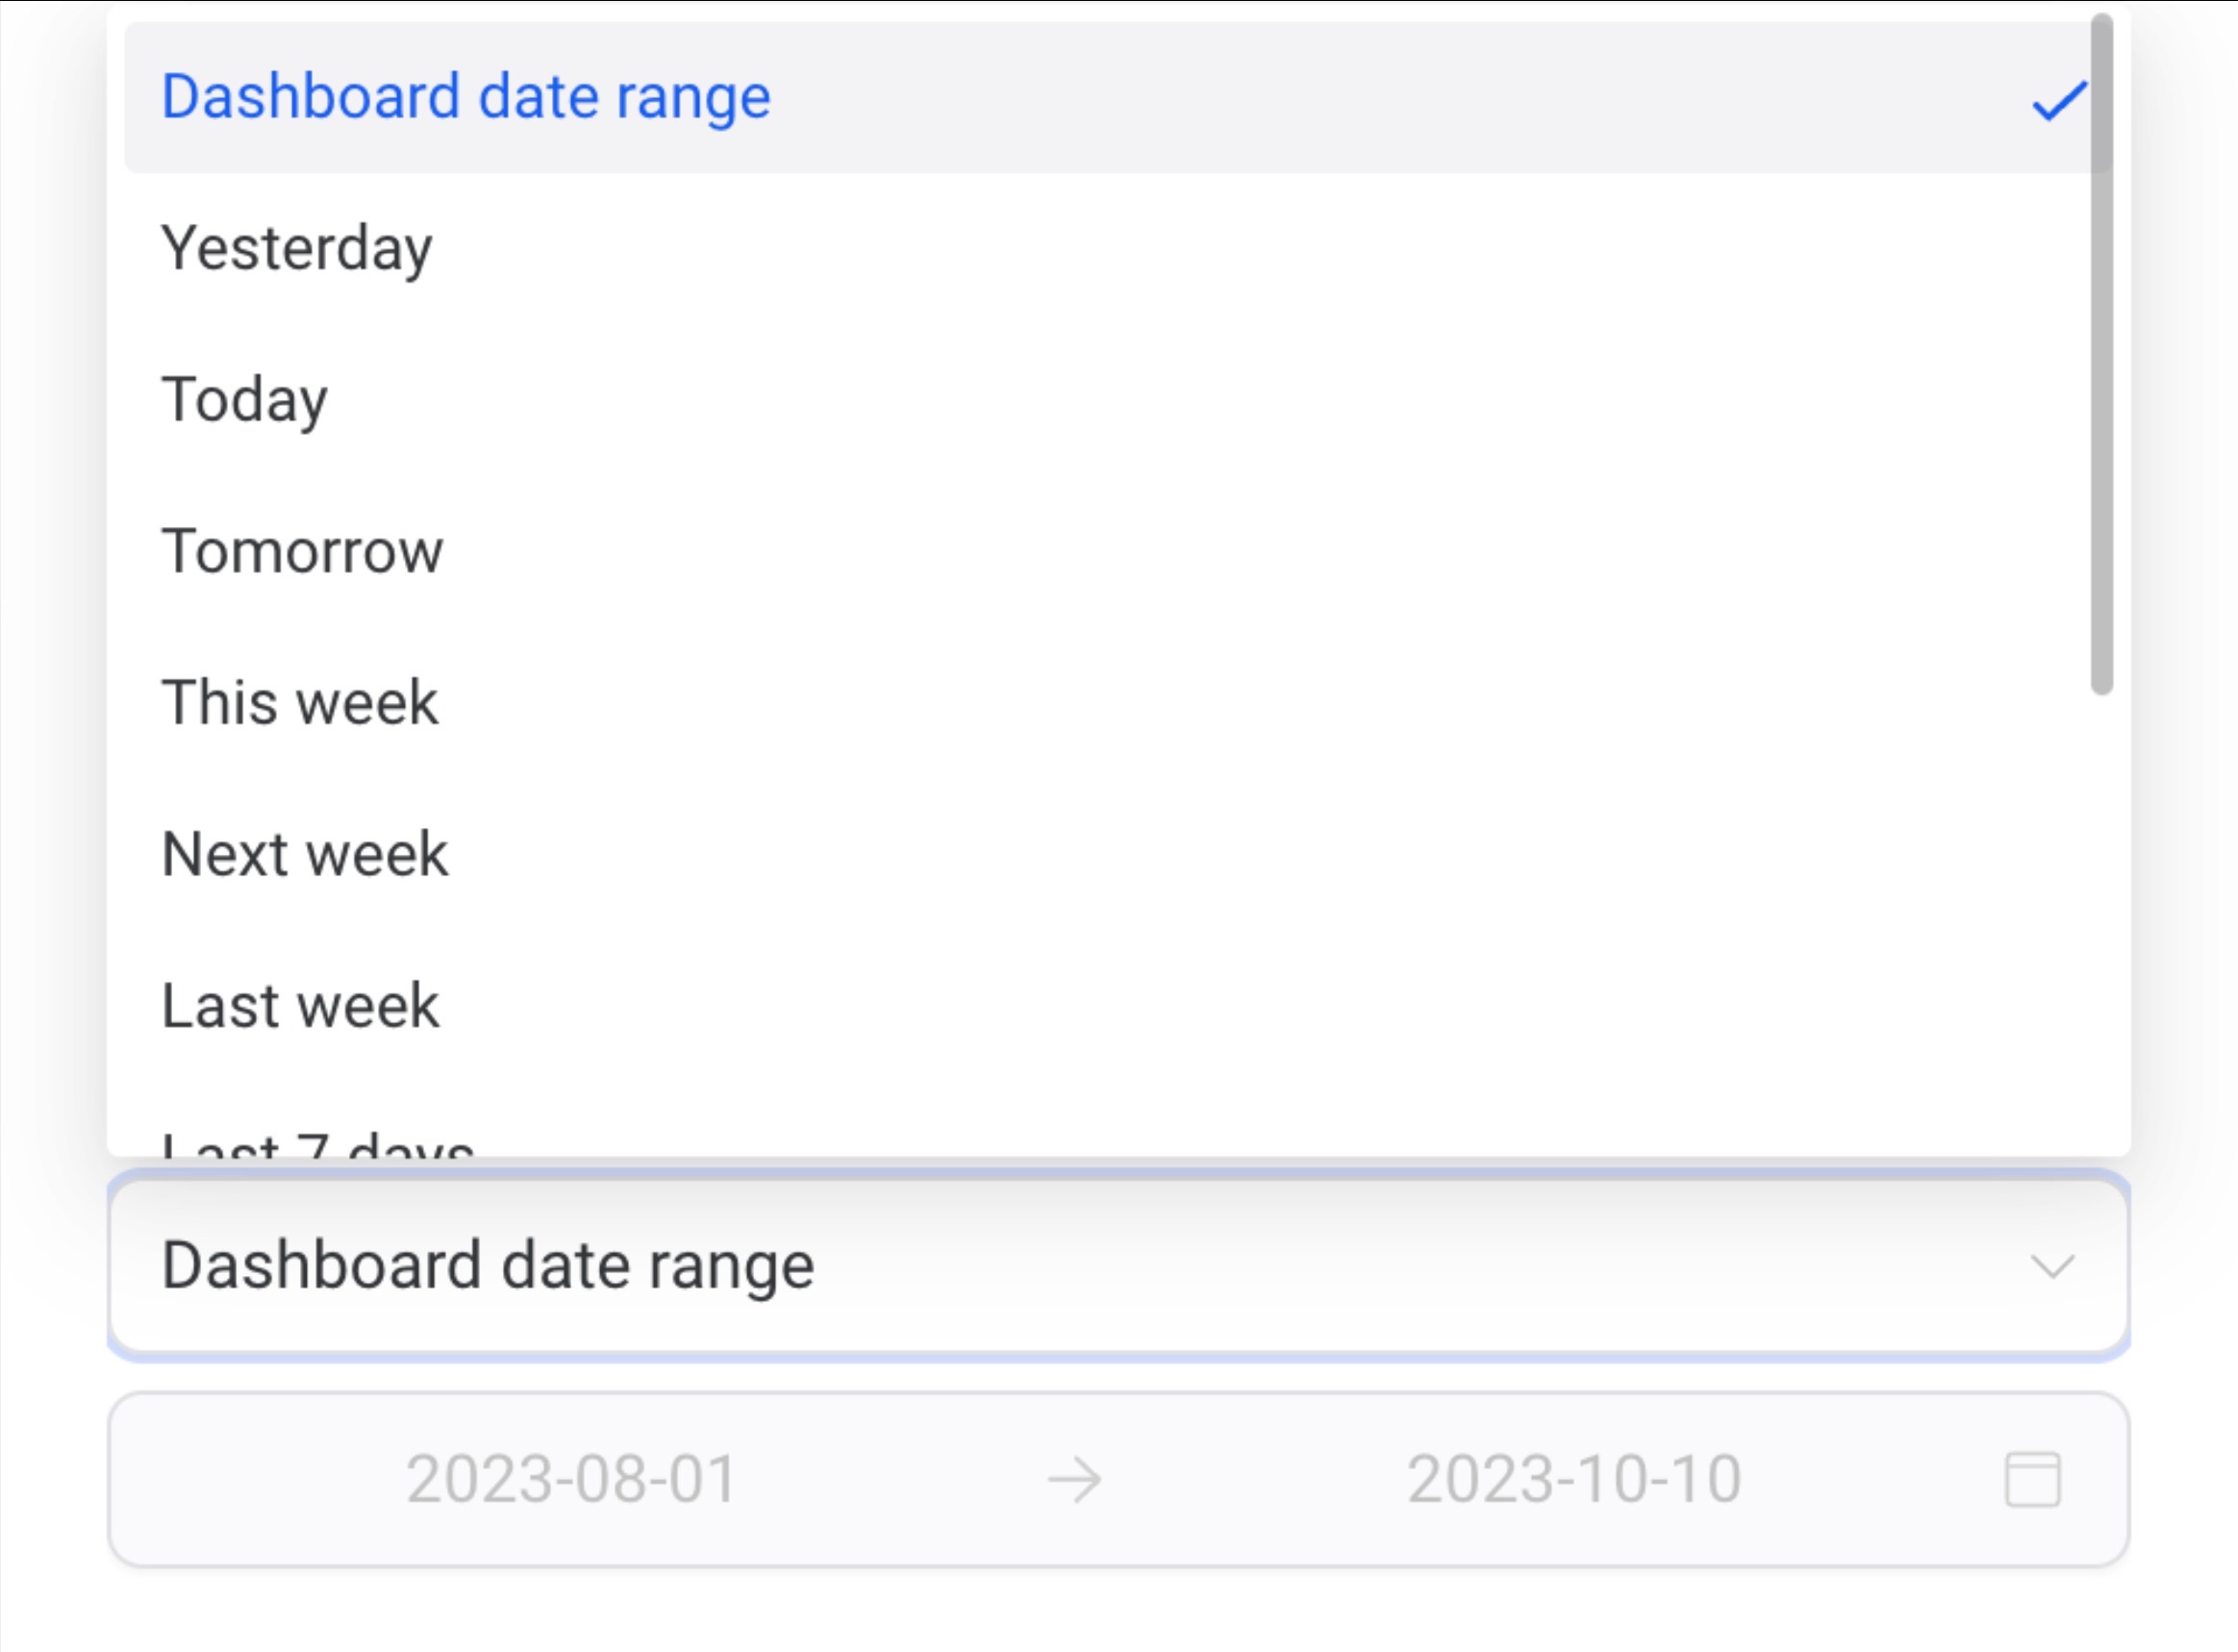
Date Range Override
Override the dashboards global date range for this widget.
Order
Sort the results in ascending or descending order.

Limit
Set a maximum number of results displayed.
Comparison Date Property
Add a comparison percentage for better context.

Step 2.2: Add Conditions
- Click on the “Conditions” Tab.
- This opens the settings panel, where you can add Conditions and filters.
Here you can choose filter, operator and parameters. Add multiple filters using AND/OR conditions or delete any unnecessary ones.

Step 2.3: Customize the Widgets Theme
- Click on the “Themes” Tab.
- This opens the settings panel, where you can add a Theme for this specific Widget.

Step 3: Reorder Widgets for Better Organization
- Drag and drop widgets to rearrange them based on priority or visibility.
- Place the most critical widgets, such as “Opportunities” or “Conversion Rates,” at the top for quick access.
- Group similar widgets together and add a Title Element to create a structured layout.
Step 4: Add or Remove Widgets
- Use the "+ Add Widget" button at the top-right corner to bring in new widgets.

- Select from pre-configured widgets or create a custom widget tailored to specific data insights. Customize these Widgets using the Settings just like in Step 2.
 |
 |
- To remove a widget, click the “Delete” Button in the widget settings panel.

Step 5: Cancel or Save Changes
- After customizing ensure the layout and data align with your requirements.
- Once satisfied, hit Save Changes to finalize the changes, or Cancel the changes.

Conclusion
Customizing your dashboard widgets empowers you to create a workspace tailored to your unique needs. By organizing widgets, applying filters, and choosing the right visualizations, you can turn your dashboard into a powerful tool for data analysis and decision-making. Remember, your dashboard should reflect your goals—keep experimenting with layouts and settings until it perfectly aligns with your workflow. With the right setup, your dashboard becomes more than just a data display; it’s a dynamic resource for driving success.
Conclusion
Dashboard widgets empower you to turn complex data into actionable insights, offering a tailored and streamlined approach to data visualization and analysis. By leveraging their customizable nature, you can design a dashboard that aligns with your workflow and business objectives, ensuring efficiency and clarity. Whether you’re tracking sales, monitoring campaigns, or analyzing customer interactions, these widgets provide the flexibility and precision needed to drive informed decision-making. Dive into the details, experiment with configurations, and unlock the full potential of your dashboard today!