
Mastering Dashboard Widgets: A Step-by-Step Customization Guide
Dashboard widgets are essential tools for visualizing key data points, offering insights into your business's performance. Customizing these widgets ensures they align with your specific goals and reporting needs. This guide provides a comprehensive walkthrough on modifying widget settings, applying filters, experimenting with various chart types, and fine-tuning displays. By tailoring your dashboard widgets, you can transform your dashboard into an effective and visually compelling data center, enhancing your ability to make informed decisions.
Step 1: Access Your Dashboard
- Navigate to the dashboard feature to view your default Dashboard.

- Switch to the Dashboard you want to edit and ensure you are in "Edit Mode" to make changes to the layout or widgets.

Step 2.1: Open and Configure the Widget Settings
- Locate the widget you'd like to customize.
- Hover over it and click on the Settings Icon in the top-right corner of the widget, select the “Edit” Button.

- This opens the settings panel, where you can make adjustments. Also choose a chart type for the selected Widget in the top section of the Settings Panel.

Here you can rename the Widgets Title, update the data points displayed in the widget under Metrics, define grouping options for charts, select the secondary dimension for visualizations like line or bar charts, adjust the time period frequency, choose the date type and much more. Some of the following Settings are Advanced Settings which are optional settings for further personalization. Some of these Settings will not be available depending on which Widget you are editing.
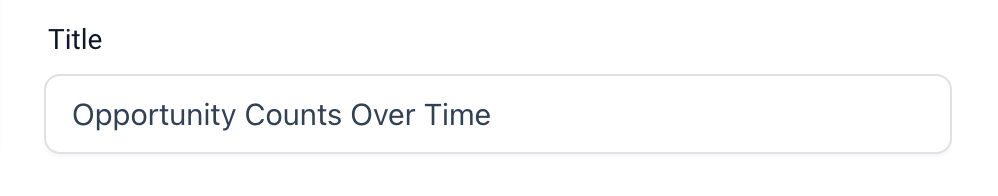
Title
Rename the widget to make its purpose clear.
Metrics
Update the data points displayed in the widget.

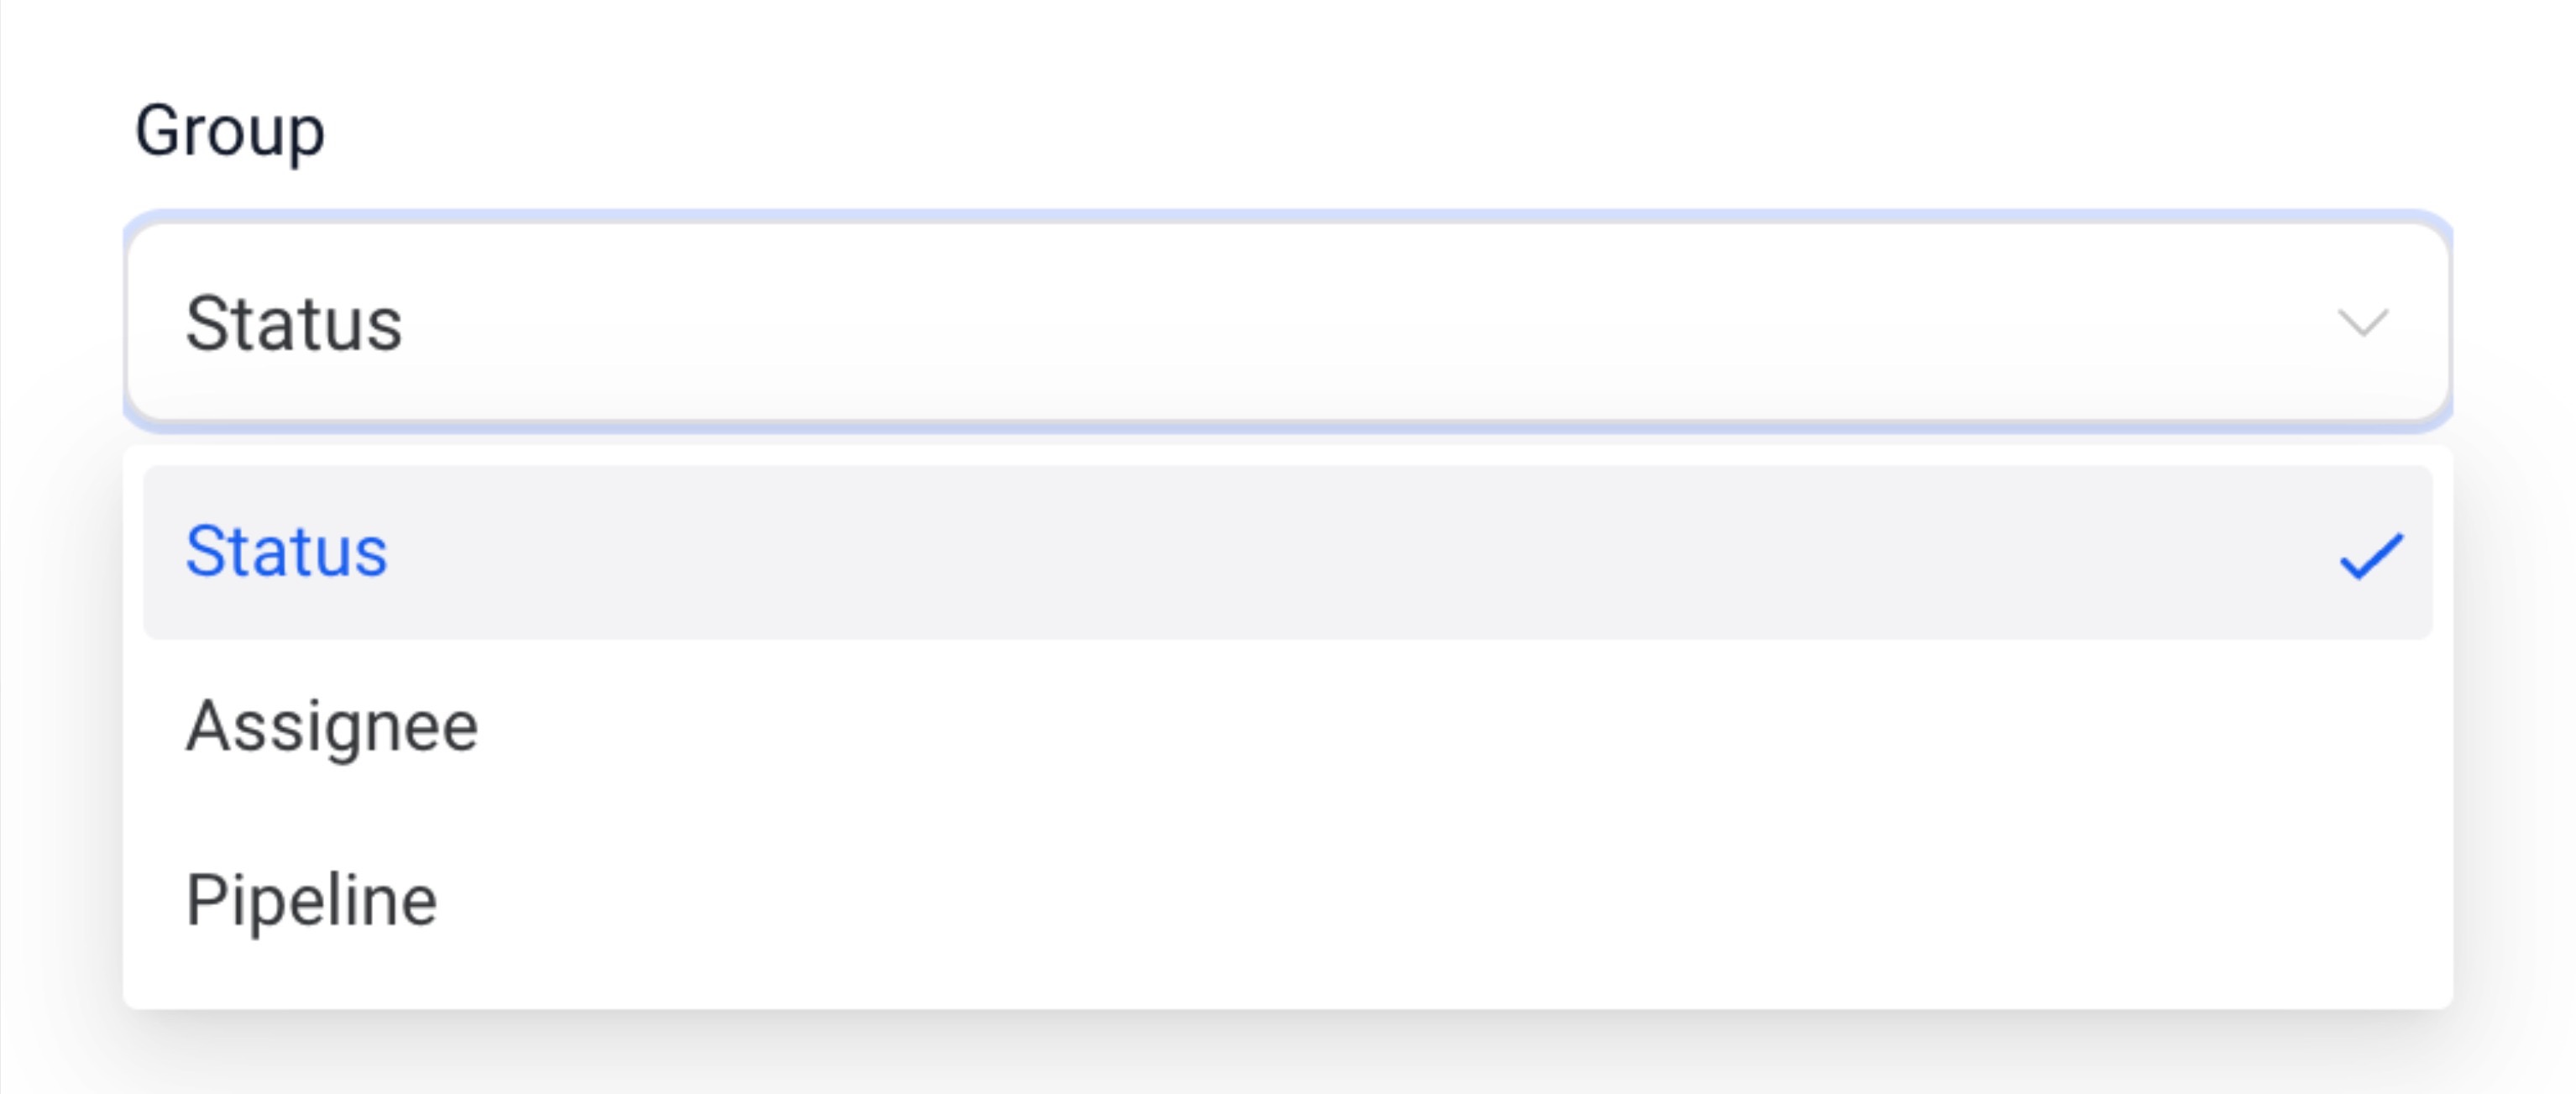
Group
Define grouping options for charts like a Donut or Bar Chart.
View By
Select the secondary dimension for visualizations like line or bar charts.
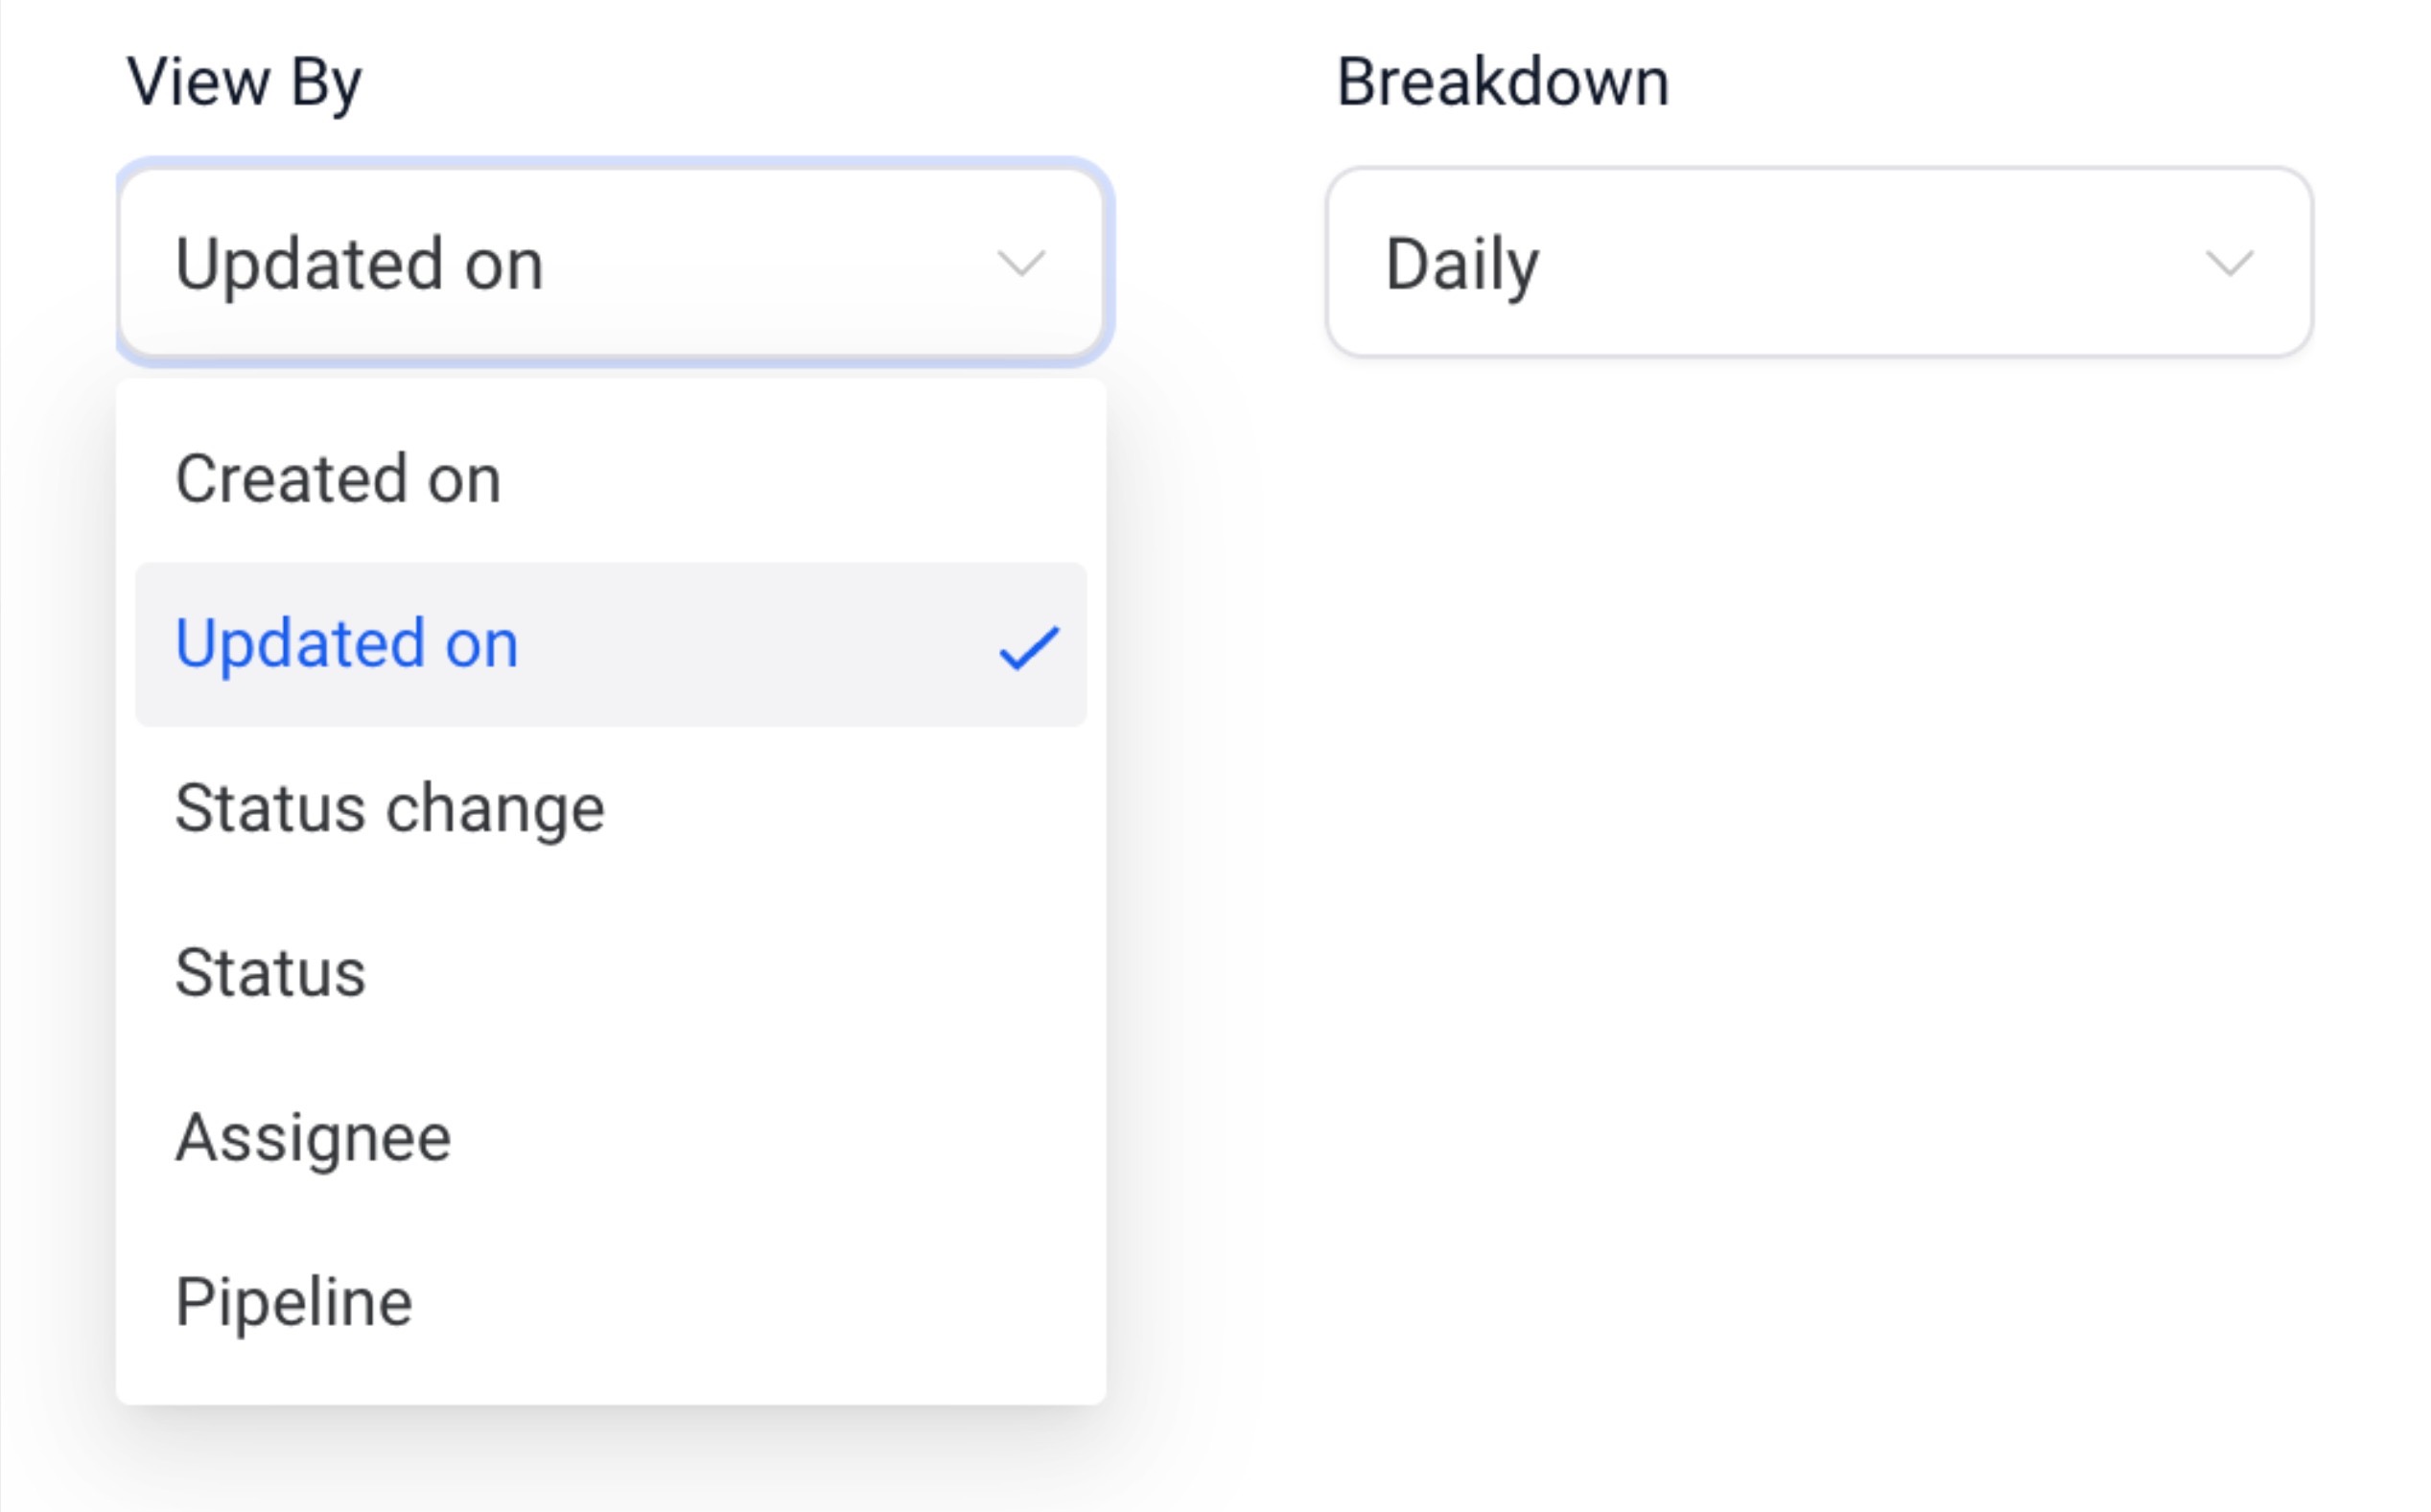
Breakdown
Adjust the time period frequency.
Date Property
Choose the date type for fetching results.

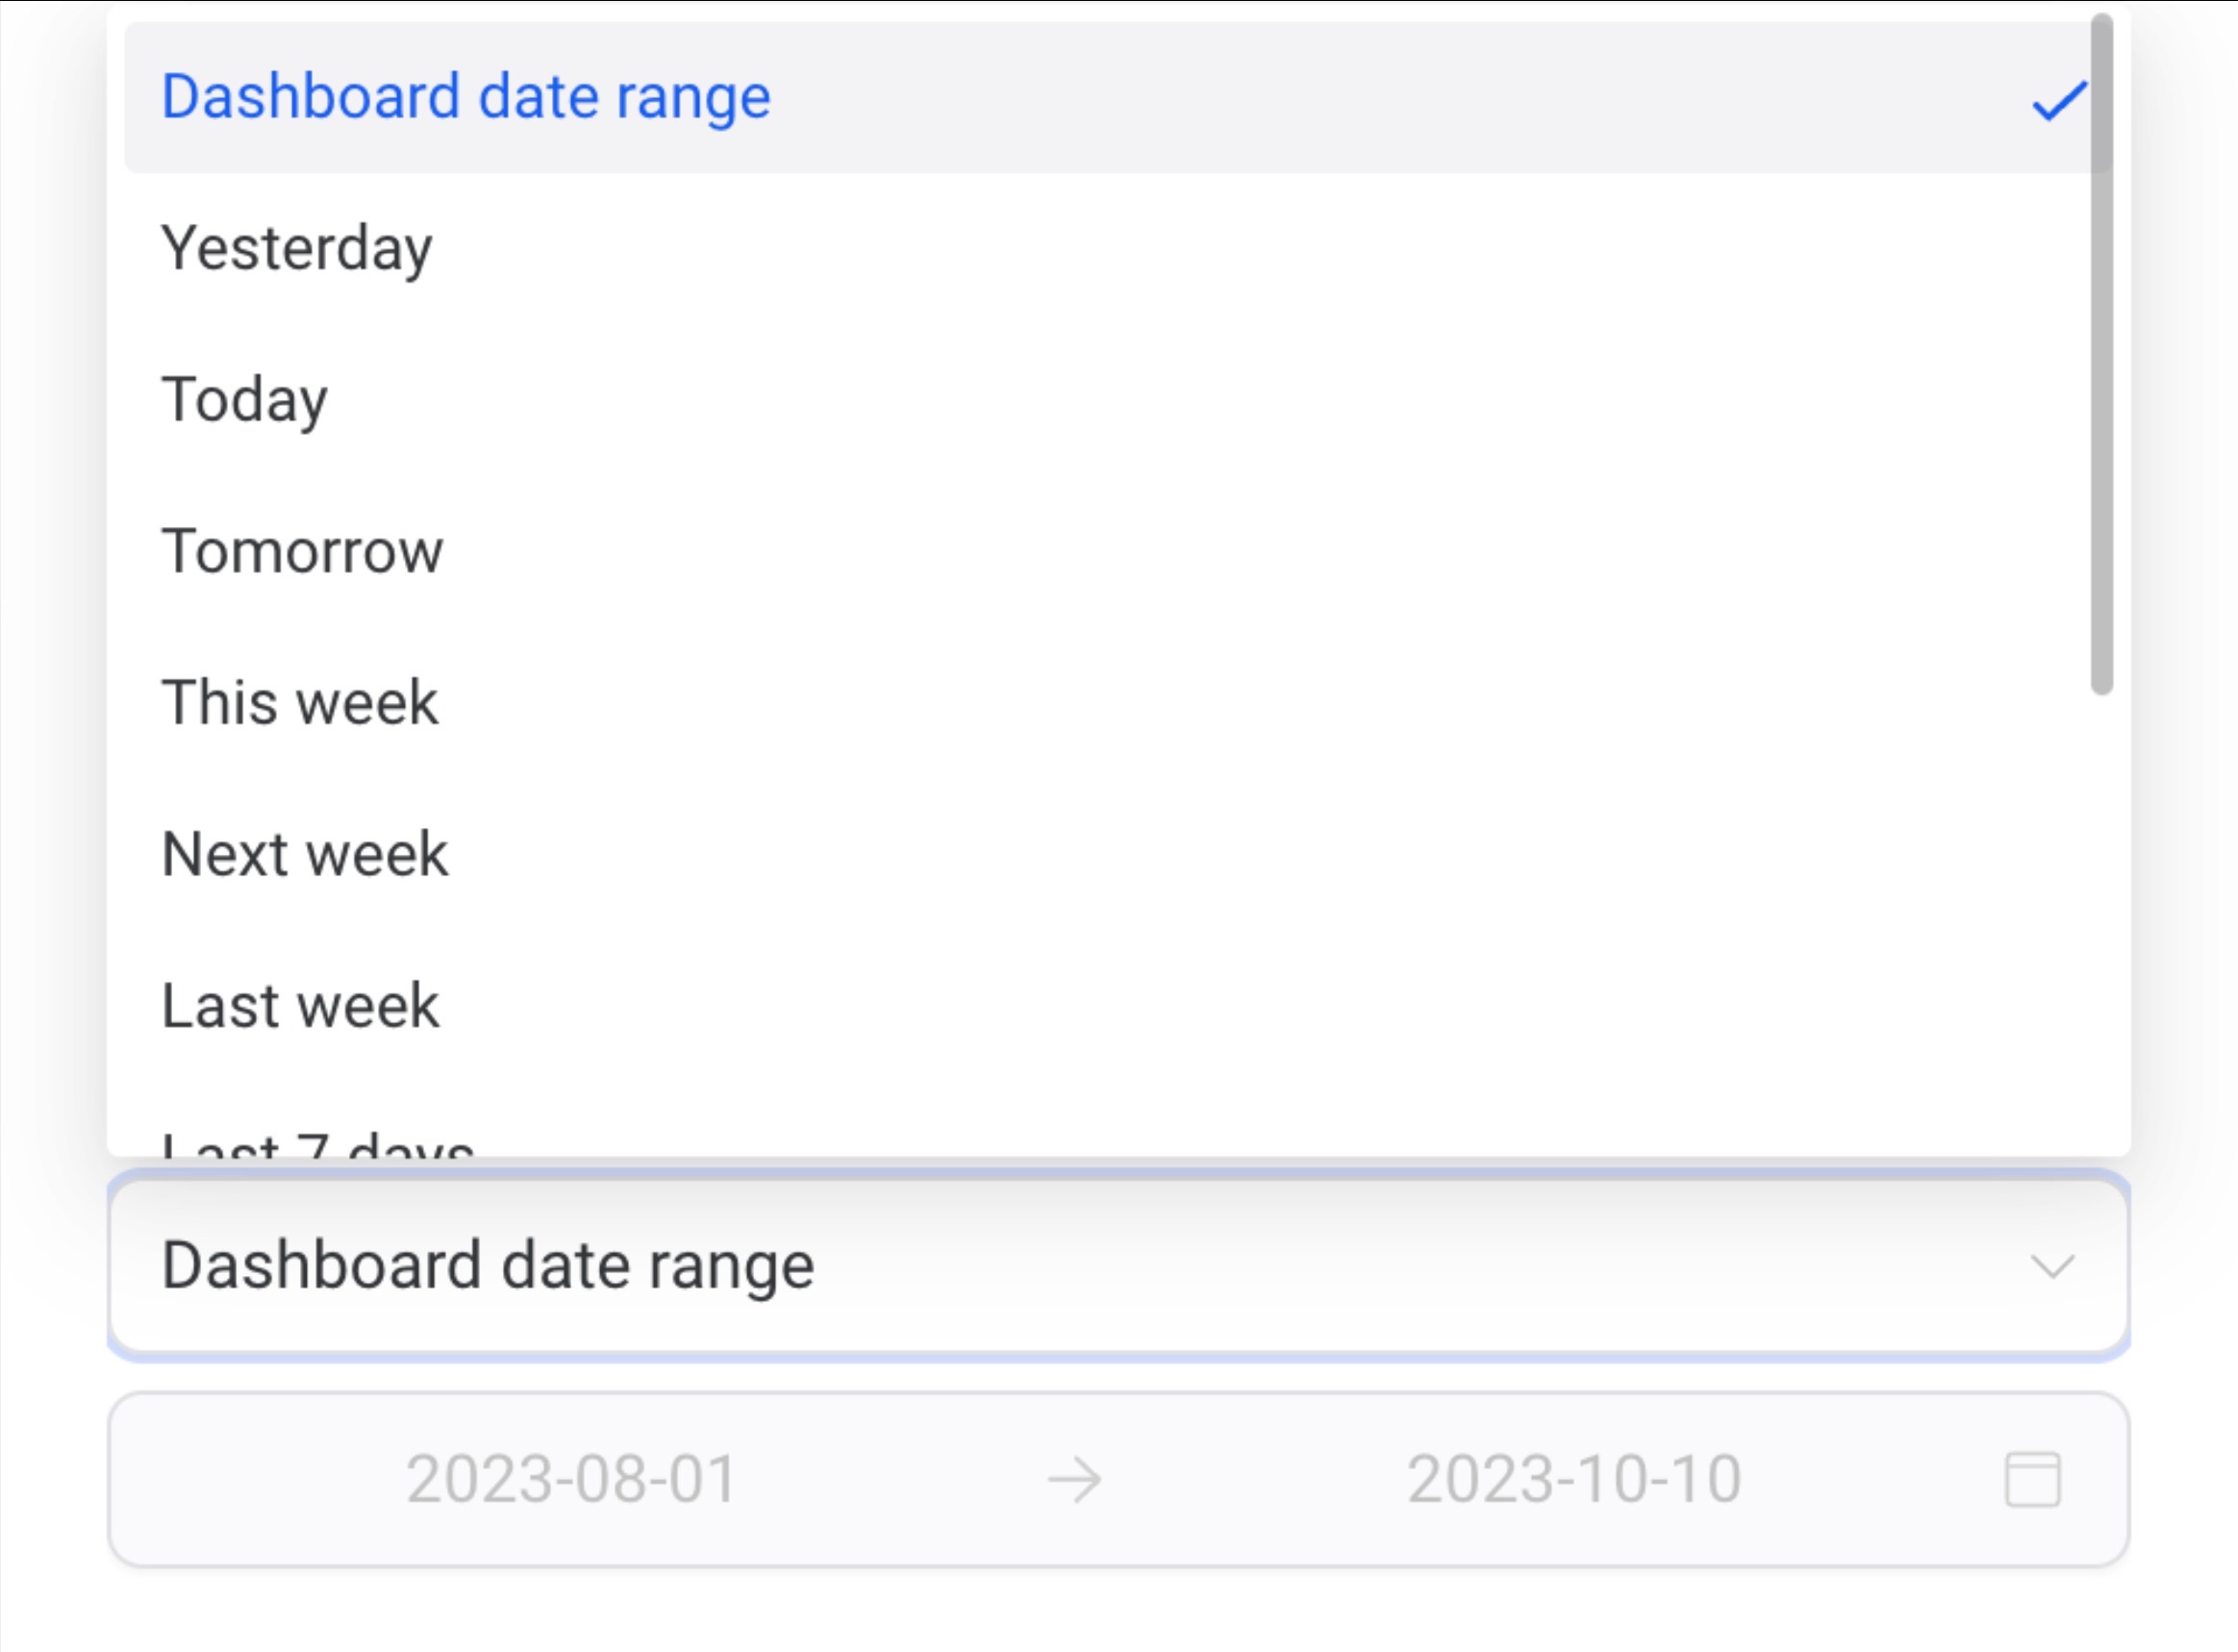
Date Range Override
Override the dashboards global date range for this widget.
Order
Sort the results in ascending or descending order.

Limit
Set a maximum number of results displayed.
Comparison Date Property
Add a comparison percentage for better context.

Step 2.2: Add Conditions
- Click on the “Conditions” Tab.
- This opens the settings panel, where you can add Conditions and filters.
Here you can choose filter, operator and parameters. Add multiple filters using AND/OR conditions or delete any unnecessary ones.

Step 2.3: Customize the Widgets Theme
- Click on the “Themes” Tab.
- This opens the settings panel, where you can add a Theme for this specific Widget.

Step 3: Reorder Widgets for Better Organization
- Drag and drop widgets to rearrange them based on priority or visibility.
- Place the most critical widgets, such as “Opportunities” or “Conversion Rates,” at the top for quick access.
- Group similar widgets together and add a Title Element to create a structured layout.
Step 4: Add or Remove Widgets
- Use the "+ Add Widget" button at the top-right corner to bring in new widgets.

- Select from pre-configured widgets or create a custom widget tailored to specific data insights. Customize these Widgets using the Settings just like in Step 2.
 |
 |
- To remove a widget, click the “Delete” Button in the widget settings panel.

Step 5: Cancel or Save Changes
- After customizing ensure the layout and data align with your requirements.
- Once satisfied, hit Save Changes to finalize the changes, or Cancel the changes.

Conclusion
Customizing your dashboard widgets empowers you to create a workspace tailored to your unique needs. By organizing widgets, applying filters, and choosing the right visualizations, you can turn your dashboard into a powerful tool for data analysis and decision-making. Remember, your dashboard should reflect your goals—keep experimenting with layouts and settings until it perfectly aligns with your workflow. With the right setup, your dashboard becomes more than just a data display; it’s a dynamic resource for driving success.